5. Demo setup
Table of Contents
5.1. Demo in the Google Cloud
You will need the bitd-<version>-<platform>.rpm for this demo. On your google cloud account, create a VM instance of*small* type (1 shared VCPU, 1.7GB memory) with a CentOS 7 boot disk. Open an ssh connection in browser window.
5.1.1. Install docker
Install docker with instructions from https://www.digitalocean.com/community/tutorials/how-to-install-and-use-docker-on-centos-7
sudo yum check-update
mkdir docker; cd docker
curl -fsSL https://get.docker.com/ | sh
sudo systemctl start docker
sudo systemctl enable docker
sudo usermod -aG docker $(whoami)
Log out, and log back in for the last command to take effect. Check that docker is running as non-root user:
docker run hello-world
5.1.2. Install Graphite and Grafana
Execute these docker commands:
docker run -d \
     --name graphite \
     --restart=always \
     -p 80:80 \
     -p 2003-2004:2003-2004 \
     -p 2023-2024:2023-2024 \
     -p 8125:8125/udp \
     -p 8126:8126 \
     graphiteapp/graphite-statsd
docker run -d \
     --name grafana \
     --restart=always \
     -p 3000:3000 \
     grafana/grafana
If you open the external IP of the host, you should see your Graphite server. The Grafana server is opened at port 3000, and that has to be manually opened in the Google Cloud,
Log into Grafana, and set up Graphite as a data source. The HTTP URL for Graphite should be http://ip-address-of-host, rather than http://localhost (because Grafana is running inside a Docker container, and it needs to reach to the host side IP to access Graphite).
5.1.3. Install the bitdribble rpm
Use scp to transfer bitd-<version>-<platform>.rpm to the host. You will need to install libyaml first:
sudo yum install libyaml
sudo rpm -ivh bitd-<version>-<platform>.rpm
Edit the config file /etc/bitd.yml to enable the tasks you are running. Enable and start the service:
sudo systemctl start bitd
sudo systemctl enable bitd
Log messages are sent to /var/log/bitd. You can enable log messages and log levels in /etc/bitd.yml.
1 2 3 4 5 6 7 8 9 10 11 12 | modules:
module-name: bitd-config-log
task-inst:
task-name: config-log
task-inst-name: config-log
schedule:
type: config
input:
log-level: trace
log-key:
key-name: bitd-sink-graphite
log-level: warn
|
Possible log levels are none, crit, error, warn, info, debug, trace. The log-key can be used to enable subsystem level logs, assuming you know the key-name of the subsystem. Any change to /etc/bitd.yml requires a server restart:
sudo systemctl reload bitd
We now configure two ping tests, with a periodic schedule, using the bitd-exec module, and a sink task using the bitd-sink-graphite module. The sink task sends results to a graphite database back end configued by the server parameter - in this case, localhost:2003 because the Graphite server is running locally and statsd is listening on TCP port 2003.
To ensure the ping output (and error) is passed as input to the sink, we configure the tag of sink: graphite as parameter to both the ping instances, as well as a parameter to the graphite sink.
1 2 3 4 5 6 7 8 9 10 11 12 13 14 15 16 17 18 19 20 21 22 23 24 25 26 27 28 29 30 31 32 33 34 35 36 37 38 39 40 41 42 43 44 45 46 | modules:
module-name: bitd-config-log
module-name: bitd-exec
module-name: bitd-sink-graphite
task-inst:
task-name: config-log
task-inst-name: config-log
schedule:
type: config
input:
log-level: trace
log-key:
key-name: bitd-sink-graphite
log-level: warn
task-inst:
task-name: exec
task-inst-name: ping_to_localhost
schedule:
type: periodic
interval: 10s
args:
command: ping -c 1 localhost|grep rtt|awk '{print $4}'| sed s:/:\ :g|awk '{printf "%.3f", $1}'
command-tmo: 10
tags:
sink: graphite
task-inst:
task-name: exec
task-inst-name: ping_to_mit
schedule:
type: periodic
interval: 30s
args:
command: ping -c 1 mit.edu|grep rtt|awk '{print $4}'| sed s:/:\ :g|awk '{printf "%.3f", $1}'
command-tmo: 10
tags:
sink: graphite
task-inst:
task-name: sink-graphite
task-inst-name: sink-graphite
schedule:
type: triggered-raw
tags:
sink: graphite
args:
server: localhost:2003
queue-size: 1000000
|
Again restart the bitd service after editing /etc/bitd.yml.
sudo systemctl reload bitd
The task results can be visualized on the Grafana dashboard at HTTP port 3000. Finally, let’s create two additional curl tasks using the bitd-exec module:
1 2 3 4 5 6 7 8 9 10 11 12 13 14 15 16 17 18 19 20 21 22 23 24 25 26 27 28 29 30 31 32 33 34 35 36 37 38 39 40 41 42 43 44 45 46 47 48 49 50 51 52 53 54 55 56 57 58 59 60 61 62 63 64 65 66 67 68 | modules:
module-name: bitd-config-log
module-name: bitd-exec
module-name: bitd-sink-graphite
task-inst:
task-name: config-log
task-inst-name: config-log
schedule:
type: config
input:
log-level: trace
log-key:
key-name: bitd-sink-graphite
log-level: warn
task-inst:
task-name: exec
task-inst-name: ping_to_localhost
schedule:
type: periodic
interval: 10s
args:
command: ping -c 1 localhost|grep rtt|awk '{print $4}'| sed s:/:\ :g|awk '{printf "%.3f", $1}'
command-tmo: 10
tags:
sink: graphite
task-inst:
task-name: exec
task-inst-name: ping_to_mit
schedule:
type: periodic
interval: 30s
args:
command: ping -c 1 mit.edu|grep rtt|awk '{print $4}'| sed s:/:\ :g|awk '{printf "%.3f", $1}'
command-tmo: 10
tags:
sink: graphite
task-inst:
task-name: exec
task-inst-name: web_to_localhost
schedule:
type: periodic
interval: 10s
args:
command: 'curl -w "time_total: %{time_total}\ndetail: \n time_namelookup: %{time_namelookup}\n time_connect: %{time_connect}\n time_appconnect: %{time_appconnect}\n time_pretransfer: %{time_pretransfer}\n time_redirect: %{time_redirect}\n time_starttransfer: %{time_starttransfer}\n" -Ss --output /dev/null http://localhost:3000'
command-tmo: 10
tags:
sink: graphite
task-inst:
task-name: exec
task-inst-name: web_to_mit
schedule:
type: periodic
interval: 30s
args:
command: 'curl -w "time_total: %{time_total}\ndetail: \n time_namelookup: %{time_namelookup}\n time_connect: %{time_connect}\n time_appconnect: %{time_appconnect}\n time_pretransfer: %{time_pretransfer}\n time_redirect: %{time_redirect}\n time_starttransfer: %{time_starttransfer}\n" -Ss --output /dev/null http://mit.edu'
command-tmo: 10
tags:
sink: graphite
task-inst:
task-name: sink-graphite
task-inst-name: sink-graphite
schedule:
type: triggered-raw
tags:
sink: graphite
args:
server: localhost:2003
queue-size: 1000000
|
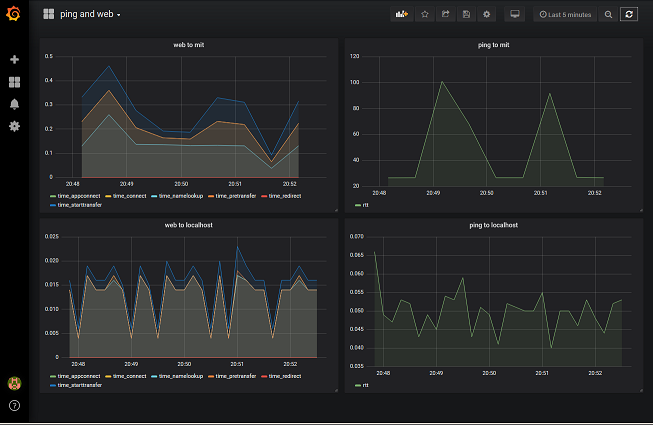
Turn again to the Grafana dashboard at port 3000. This is a sample of how results are displayed (requires dashboard configuration):